- Analytics
- Market Data
- Stock CFDs Prices
- Tesla Share Price Today
Tesla Share Price Chart
This page includes full information about the Tesla stock, including the Tesla stock chart and dynamics on the chart by choosing any of 8 available time frames.
By moving the start and end of the timeframe in the bottom panel you can see both the current and the historical price movements of the instrument. In addition, you have an opportunity to choose the type of display of the Tesla share price – Candles or Lines chart – through the buttons in the upper left corner of the chart. All clients that have not yet decided which instrument to trade are in the right place since reading the full characteristics of the Tesla stock and watching its performance on the charts will help them to make their final decision.
Tesla Share Price Today
- 1 MIN
- 5m
- 15m
- 30m
- 1h
- 4h
- 1d
- 1w
This page includes full information about the Tesla, including the Tesla live chart and dynamics on the chart by choosing any of 8 available time frames.
By moving the start and end of the timeframe in the bottom panel you can see both the current and the historical price movements of the instrument. In addition, you have an opportunity to choose the type of display of the Tesla live chart – Candles or Lines chart – through the buttons in the upper left corner of the chart. All clients that have not yet decided which instrument to trade are in the right place since reading the full characteristics of the TSLA and watching its performance on the charts will help them to make their final decision.
Tesla Technical Analysis
The technical analysis of the Tesla stock price chart on daily timeframe shows #S-TSLA,Daily is retracing down after testing the 200-day moving average MA(200). We believe the bearish momentum will continue after the price breaches below the lower boundary of Donchian channel at 214.09. This level can be used as an entry point for placing a pending order to sell. The stop loss can be placed at 274.38. After placing the order, the stop loss is to be moved every day to the next fractal high indicator, following Parabolic signals. Thus, we are changing the expected profit/loss ratio to the breakeven point. If the price meets the stop loss level (274.38) without reaching the order (214.09), we recommend cancelling the order: the market has undergone internal changes which were not taken into account.
Fundamental Analysis of Stocks - Tesla
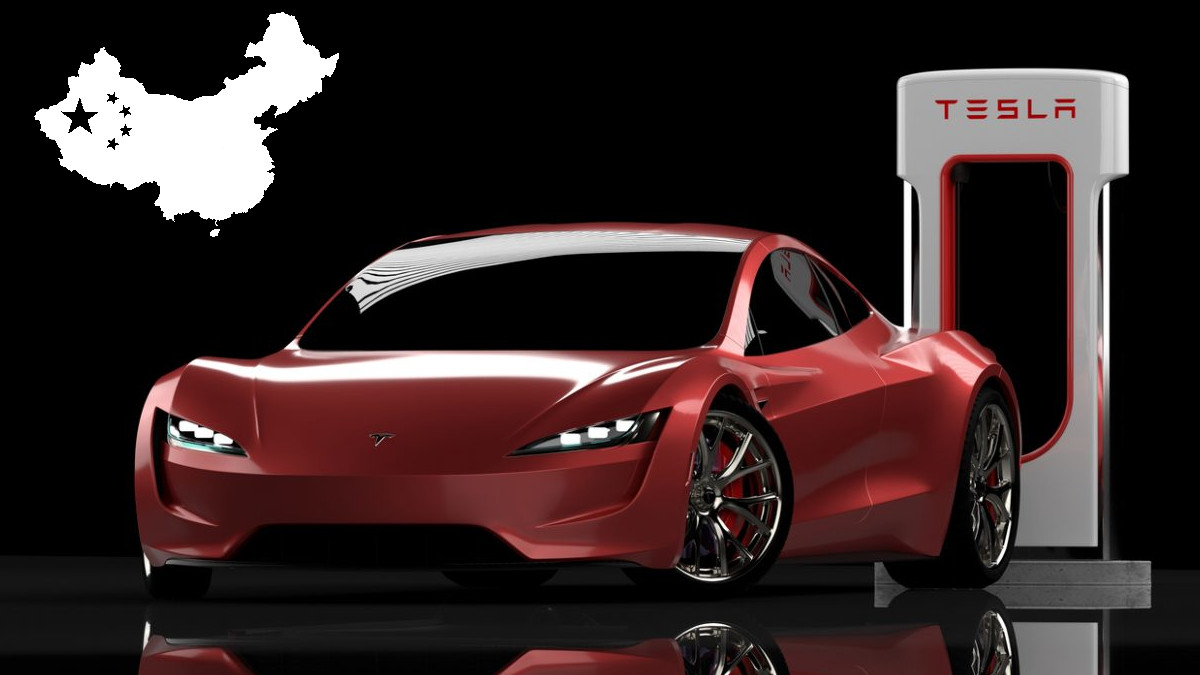
Tesla stock is in decline since president Trump ordered steep tariffs on import from Chinas. Will the Tesla stock price continue retreating?
Tesla has suspended taking new orders for two imported models - Model S and Model X vehicles on its Chinese website. Both models are assembled in Tesla’s factories in Fremont, California, and Tilburg, Netherlands, and are exported to China. While no information has been released for the reason for orders suspension, Tesla CEO Elon Musk had recently said that president Trump’s steep tariffs on China - which were hiked to 145% this week- stood to “significantly” impact the EV maker. China is a major market and production hub for Tesla. New orders suspension for Model S and Model X vehicles in China is bearish for Tesla stock price.
| Indicator | Signal |
| RSI | Neutral |
| MACD | Buy |
| Donchian Channel | Sell |
| MA(200) | Sell |
| Fractals | Sell |
| Parabolic SAR | Sell |
Tesla News

BYD’s Five-Minute EV Charging: Just Hype?
BYD claims its new ultra-fast charging tech can add 250 miles of range in five minutes. If true, it could disrupt the EV...

Tesla Stock Price Analysis
Tesla is set to report its Q2 earnings on July 17th, but before that investors are waiting on news of its Q2 deliveries this...

Why Tesla is cutting production of Model Y in China
Tesla has slashed production of its best-selling Model Y electric car at its Shanghai plant by a double-digit percentage...

Tesla Downgraded by Wells Fargo: Sell Signal or Overreaction?
Date: March 13, 2024 News:Wells Fargo downgraded Tesla (TSLA) stock from Equal Weight to Underweight (sell recommendation)....

Bulls vs. Bears: Will Tesla Conquer the Chinese EV Market?
Tesla has made significant steps in China market over the past few years and it hasn’t been without challenges. Let’s...
