- Education
- Forex Technical Analysis
- Technical Indicators
- Volume Weighted Average Price
Volume Weighted Average Price: Definition, Formula and How to Use
The Volume Weighted Average Price (VWAP) indicator is a powerful tool used by traders and investors to analyze the average price at which a security has traded throughout the trading day, considering both the price and volume of each transaction. VWAP is widely used in various markets, including stocks, futures, and forex, as it provides valuable insights into market trends and helps traders make informed decisions.
In this article, we will explore what VWAP is, how to use it effectively, and the formula and calculation methods involved. Additionally, we will discuss some common VWAP indicator settings and provide examples to illustrate its practical application.
What is Volume Weighted Average Price
The Volume Weighted Average Price (VWAP) is a statistical concept that calculates the average price of a security, weighted by the trading volume at each price level. Unlike traditional average price calculations, VWAP takes into account the significance of volume in determining the average price.
This makes VWAP an essential tool for assessing the fairness of an execution price compared to the average trading price during a given period. VWAP is typically used over a specific time frame, such as a trading day, and is recalculated throughout the day to reflect the changing market dynamics.
By considering both price and volume, VWAP offers a more accurate representation of the overall market sentiment and helps identify areas of significant trading activity.
How to Use VWAP Indicator
The Volume Weighted Average Price (VWAP) indicator is a valuable tool for traders and investors, providing insights into market trends, support and resistance levels, and the fair value of a security. Here are some common strategies for effectively using the VWAP indicator:
1. VWAP as a Trend Indicator
One of the primary uses of the VWAP indicator is to identify the prevailing trend in the market. By comparing the current price to the VWAP line, traders can determine whether the market sentiment is bullish or bearish. If the price consistently trades above the VWAP, it suggests a bullish trend, indicating that buyers are in control. Conversely, if the price consistently trades below the VWAP, it suggests a bearish trend, indicating that sellers are dominant. Traders can use this information to align their trades with the prevailing trend, increasing the probability of success.
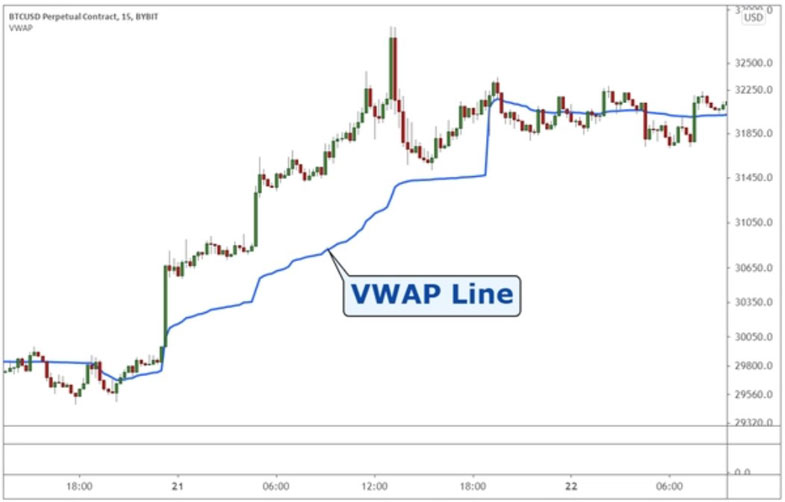
For example, if the price is above the VWAP and the VWAP is sloping upwards, it indicates a strong bullish trend. Traders may consider looking for buying opportunities or holding onto existing long positions. Conversely, if the price is below the VWAP and the VWAP is sloping downwards, it indicates a strong bearish trend. Traders may look for selling opportunities or consider shorting the security.
2. VWAP as a Support and Resistance Level
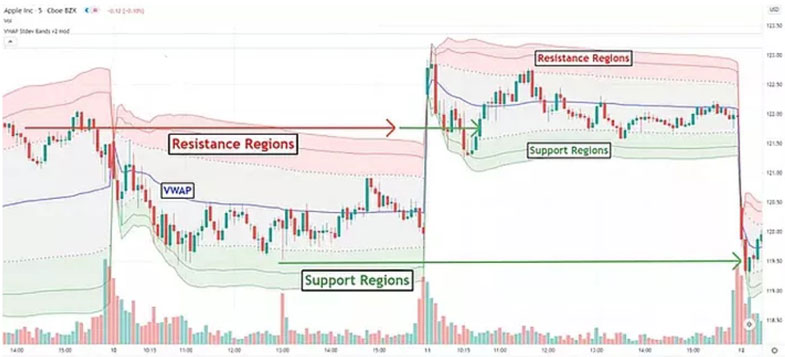
The VWAP indicator can also act as a significant support or resistance level. As the VWAP represents the average price at which a security has traded, it holds significance for market participants.
Traders often observe how the price reacts when it approaches the VWAP line. If the price consistently bounces off the VWAP, it can be considered a support or resistance level, influencing future price movements.
For instance, if the price approaches the VWAP from below and bounces off, it suggests a potential support level. Traders may consider buying near the VWAP with the expectation of a price reversal or a continuation of an upward trend.
Conversely, if the price approaches the VWAP from above and encounters resistance, it indicates a potential resistance level. Traders may consider selling or shorting the security near the VWAP, expecting a price reversal or a continuation of a downward trend.
3. VWAP Bands
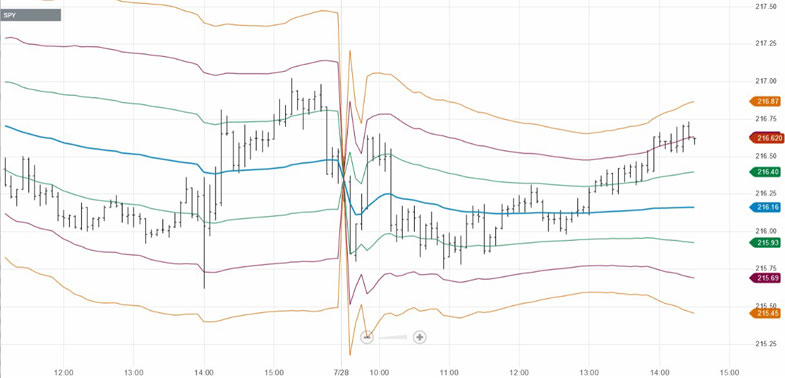
Traders can enhance the VWAP indicator by adding standard deviations to create bands around the VWAP line. These bands serve as potential support and resistance levels, indicating price areas where the security may encounter buying or selling pressure. The width of the bands can be adjusted based on the trader's preference and the market's volatility.
For example, by adding one standard deviation above and below the VWAP, traders can create bands that capture approximately 68% of price activity. These bands can help identify areas of potential price reversals or breakouts.
When the price approaches the upper band, it suggests potential overbought conditions, indicating a possible reversal or a resistance level. Conversely, when the price approaches the lower band, it suggests potential oversold conditions, indicating a possible reversal or a support level.
4. VWAP Crossovers
Traders can also utilize VWAP crossovers as a signal for potential trend changes. A VWAP crossover occurs when the price crosses above or below the VWAP line. A bullish crossover happens when the price moves above the VWAP, indicating a shift from bearish to bullish sentiment.
Conversely, a bearish crossover occurs when the price moves below the VWAP, indicating a shift from bullish to bearish sentiment. Traders can use these crossovers as entry or exit signals, confirming a potential trend reversal or continuation.
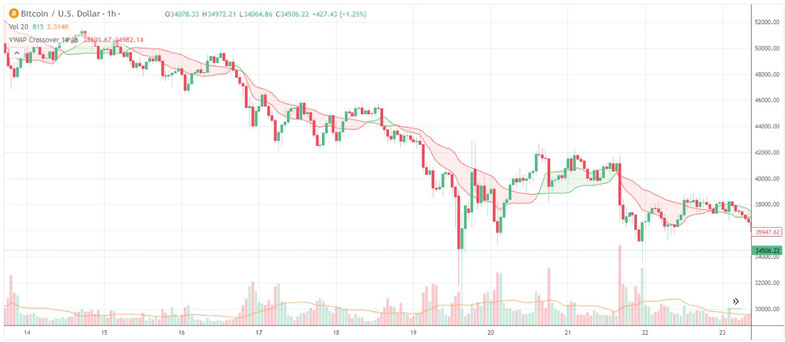
It's important to note that the VWAP indicator should not be used in isolation but in conjunction with other technical analysis tools and indicators to validate trading decisions. Additionally, traders should consider the overall market context, news events, and risk management principles when using the VWAP indicator to make informed trading decisions.
In conclusion, the VWAP indicator is a versatile tool that can provide valuable insights into market trends, support and resistance levels, and fair value. By using the VWAP in conjunction with other technical analysis tools, traders can enhance their decision-making process and potentially improve trading outcomes. It is recommended to practice and backtest different strategies incorporating the VWAP indicator to find the most suitable approach for individual trading styles and market conditions.
Volume Weighted Average Price Formula
The formula for calculating VWAP involves multiplying the price of each trade by its corresponding volume, summing up these values, and then dividing by the total volume:
VWAP = ∑(Price × Volume) / Total Volume
The VWAP formula accounts for each trade's volume, ensuring that heavily traded periods carry more weight in the average price calculation.
Volume Weighted Average Price Calculation
Calculating the Volume Weighted Average Price (VWAP) involves taking into account the price and volume of each trade to determine the average price at which a security has traded over a specific time frame.
The VWAP is commonly used to assess the fairness of an execution price and to identify trends and potential support and resistance levels. Here's how the VWAP is calculated:
1. Gather the Necessary Data
To calculate the VWAP, you'll need the price and volume data for each trade during the specified time frame. This data is typically available from trading platforms or financial data providers.
2. Multiply the Price by the Volume
For each trade, multiply the price at which the trade occurred by the corresponding volume of that trade. This calculation gives more weight to trades with higher volume, which is a key characteristic of VWAP.
3. Sum up the Price-volume Products
Add up the results obtained from multiplying the price by the volume for each trade during the specified time frame. This sum represents the total value traded over that period.
4. Calculate the Total Volume
Add up the volume of all the trades that occurred during the specified time frame. This total volume represents the cumulative volume traded.
Divide the Sum of Price-volume Products by the Total Volume
Divide the sum of the price-volume products (from step 3) by the total volume (from step 4). This calculation gives you the VWAP, which represents the average price at which the security has traded during the specified time frame.
To illustrate the VWAP calculation process, let's consider an example.
Suppose we have the following price and volume data for a security during a trading day:
Trade 1: Price = $50, Volume = 1,000
Trade 2: Price = $52, Volume = 500
Trade 3: Price = $49, Volume = 800
Trade 4: Price = $51, Volume = 1,200
Trade 5: Price = $50.50, Volume = 1,500
To calculate VWAP, we multiply each trade's price by its corresponding volume and sum up the values:
VWAP = ($50 × 1,000 + $52 × 500 + $49 × 800 + $51 × 1,200 + $50.50 × 1,500) / (1,000 + 500 + 800 + 1,200 + 1,500)
Simplifying the calculation:
VWAP = ($50,000 + $26,000 + $39,200 + $61,200 + $75,750) / 5,000
VWAP = $252,150 / 5,000 VWAP = $50.43
In this example, the VWAP for the trading day is $50.43.
VWAP Indicator Settings
The Volume Weighted Average Price (VWAP) indicator can be customized based on individual trading preferences and market conditions. Here are some common settings that traders can adjust when using the VWAP indicator:
Timeframe
Traders can select the timeframe over which they want to calculate the VWAP. The timeframe can range from a full trading day to specific hours or even intraday periods. The choice of timeframe depends on the trading strategy and the desired level of detail in analyzing market trends. For short-term traders, using shorter timeframes like 5 or 15 minutes can provide more precise information, while longer timeframes like daily VWAP are useful for swing traders and investors.
Moving VWAP
Instead of calculating VWAP for a fixed timeframe, traders can use a moving VWAP. A moving VWAP updates continuously based on a rolling time period, providing a more dynamic representation of the average price.
Moving VWAPs are commonly used to capture intraday trends and adapt to changing market conditions. Traders can adjust the rolling period based on their preferred sensitivity to recent price and volume data.
Deviations
Traders can add standard deviations to the VWAP line to create bands that indicate potential support and resistance levels. These deviation bands help identify price levels where the security may find buying or selling pressure.
The number of standard deviations determines the width of the bands and can be adjusted to match the trader's risk tolerance and volatility expectations. A larger number of deviations will result in wider bands, while a smaller number will create narrower bands.
VWAP Start Time
The VWAP calculation can start at different times depending on the trader's preference. Some traders prefer to start the VWAP calculation from the market open, while others may choose to start at a specific time, such as the first hour of trading.
Starting the VWAP calculation from a particular time can help filter out initial market noise and focus on the primary trading activity of the day.
Volume Aggregation
When calculating VWAP, traders can choose how volume is aggregated. The two common options are "tick volume" and "real volume." Tick volume considers the number of trades executed at each price level, while real volume takes into account the actual number of shares or contracts traded.
Real volume provides a more accurate representation of market activity but may not be available for all trading instruments. Tick volume is often used as a proxy and is suitable for most markets.
VWAP Type
There are different types of VWAP indicators available, and traders can choose the one that best suits their needs. Some popular VWAP types include standard VWAP, anchored VWAP (calculated from a specific point in time), and VWAP bands (VWAP with added deviation bands). Each type provides a different perspective on the average price and can be used in combination for comprehensive analysis.
Smoothing Options
Traders can apply smoothing techniques to the VWAP indicator to reduce noise and highlight the underlying trend. Moving averages, such as the exponential moving average (EMA), can be applied to the VWAP line to create a smoother representation of the average price. The choice of smoothing period depends on the trader's trading style and the desired level of responsiveness to price changes.
Bottom Line on Volume Weighted Average Price
The Volume Weighted Average Price (VWAP) indicator is a valuable tool for traders and investors, providing insights into market trends, support and resistance levels, and the fair value of a security. By considering both price and volume, VWAP offers a more comprehensive understanding of market dynamics. Traders can use VWAP in various ways, such as identifying trends, determining support and resistance levels, and creating trading strategies.
Understanding the VWAP formula and its calculation process allows traders to apply this indicator effectively. By experimenting with different VWAP settings, traders can further tailor the indicator to their specific needs. Incorporating VWAP into trading strategies can enhance decision-making and potentially improve trading outcomes.
Forex Indicators FAQ
What is a Forex Indicator?
Forex technical analysis indicators are regularly used by traders to predict price movements in the Foreign Exchange market and thus increase the likelihood of making money in the Forex market. Forex indicators actually take into account the price and volume of a particular trading instrument for further market forecasting.
What are the Best Technical Indicators?
Technical analysis, which is often included in various trading strategies, cannot be considered separately from technical indicators. Some indicators are rarely used, while others are almost irreplaceable for many traders. We highlighted 5 the most popular technical analysis indicators: Moving average (MA), Exponential moving average (EMA), Stochastic oscillator, Bollinger bands, Moving average convergence divergence (MACD).
How to Use Technical Indicators?
Trading strategies usually require multiple technical analysis indicators to increase forecast accuracy. Lagging technical indicators show past trends, while leading indicators predict upcoming moves. When selecting trading indicators, also consider different types of charting tools, such as volume, momentum, volatility and trend indicators.
Do Indicators Work in Forex?
There are 2 types of indicators: lagging and leading. Lagging indicators base on past movements and market reversals, and are more effective when markets are trending strongly. Leading indicators try to predict the price moves and reversals in the future, they are used commonly in range trading, and since they produce many false signals, they are not suitable for trend trading.

