- Education
- Forex Technical Analysis
- Technical Indicators
- Oscillators
- Aroon Oscillator
Aroon Oscillator: Formula, Settings and How to Use it
In the world of financial markets, understanding and identifying trends is crucial for successful trading. This is where the Aroon Oscillator comes into play. The Aroon Oscillator is a popular technical indicator that helps traders analyze the strength and direction of a trend. By providing valuable insights into the market's momentum and potential trend reversals, the Aroon Oscillator empowers traders with the ability to make well-informed trading decisions.
In this article we are going to learn about Aroon Oscillator; shedding light on its definition, calculation methods, interpretation, and practical applications. Whether you are an aspiring trader or an experienced professional, this article will equip you with the knowledge to effectively utilize the Aroon Oscillator in your trading strategies.

Key points to be covered in the article:
- Understanding the Aroon Oscillator
- Calculation of the Aroon Oscillator
- Interpreting the Aroon Oscillator
- Practical Applications of the Aroon Oscillator
- Combining the Aroon Oscillator with other Indicators
Aroon Oscillator indicator is a powerful tool for trend analysis, which helps to identify market direction, gauge momentum, and anticipate potential reversals. With its versatility and practical applications, the Aroon Oscillator can enhance trading strategies across various financial markets.
What is Aroon Indicator
The Aroon indicator is a popular technical analysis tool used by traders to assess trends and identify potential trend reversals in financial markets. It helps traders understand whether an asset is in an uptrend, downtrend, or a period of consolidation.
The Aroon indicator consists of two lines:
- Aroon Up line
- Aroon Down line
These lines move between the values of 0 and 100.
The Aroon Up line measures the number of periods since the highest high within a given timeframe. It indicates how long it has been since the price reached a new high. A higher value on the Aroon Up line suggests that the price has recently been reaching new highs, indicating a potential uptrend.
On the other hand, the Aroon Down line measures the number of periods since the lowest low within a given time frame. It shows how long it has been since the price reached a new low. A higher value on the Aroon Down line suggests that the price has recently been reaching new lows, indicating a potential downtrend.
Traders often analyze the relationship between the Aroon Up and Aroon Down lines.
When the Aroon Up line is above the Aroon Down line, it indicates a stronger uptrend. Conversely, when the Aroon Down line is above the Aroon Up line, it suggests a stronger downtrend.
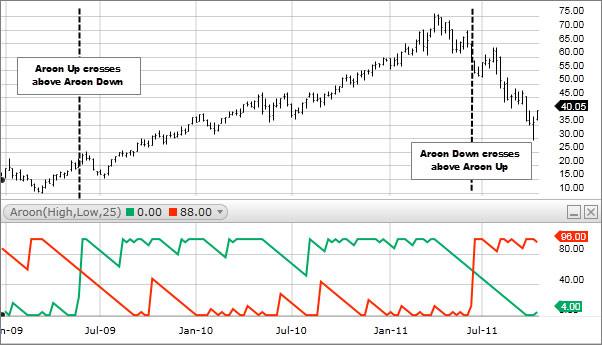
Additionally, traders look for crossovers or intersections between the two lines. When the Aroon Up line crosses above the Aroon Down line, it may signal the start of an uptrend. Conversely, when the Aroon Down line crosses above the Aroon Up line, it may indicate the beginning of a downtrend.
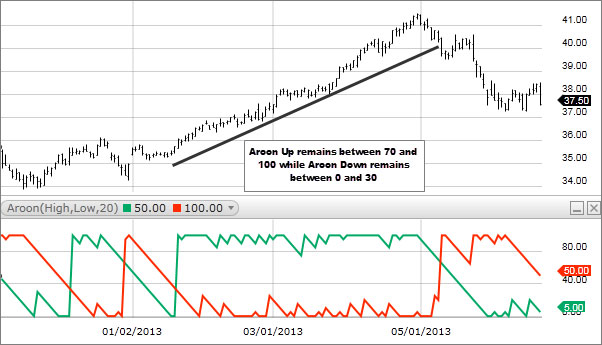
By analyzing the Aroon indicator, traders can gain insights into the strength and direction of a trend, potentially helping them make better-informed trading decisions. It is important to note that the Aroon indicator is just one tool among many, and traders often combine it with other technical indicators and analysis techniques for a more comprehensive assessment of market conditions.
How to use Aroon Indicator
The Aroon indicator is a versatile tool that can be used in various ways to analyze trends and potential trend reversals in financial markets. Here are some common ways to use the Aroon indicator:
1. Identifying Trend Strength
The Aroon indicator can help determine the strength of a trend. When the Aroon Up line is above the Aroon Down line and both lines are at higher levels, it suggests a strong uptrend.
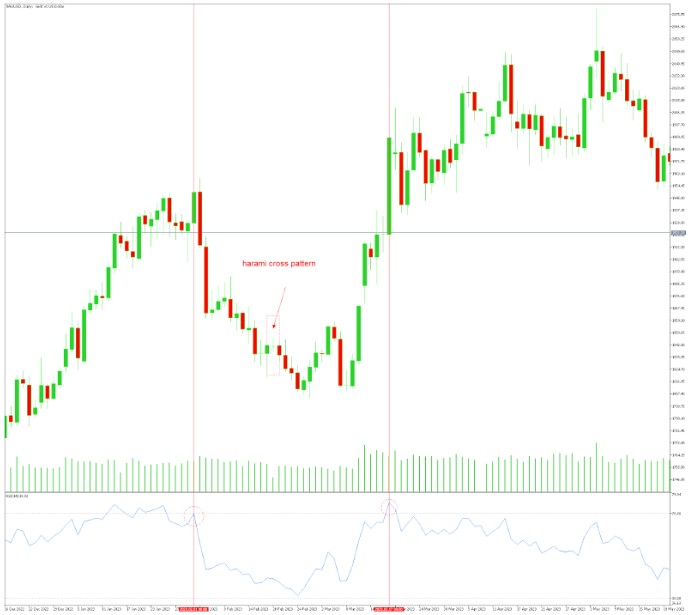
Conversely, when the Aroon Down line is above the Aroon Up line and both lines are at higher levels, it indicates a strong downtrend. Traders can use this information to assess the strength of a trend and make trading decisions accordingly.
2. Spotting Trend Reversals
The Aroon indicator can also assist in identifying potential trend reversals. When the Aroon Up line crosses below the Aroon Down line, it may signal a potential shift from an uptrend to a downtrend.
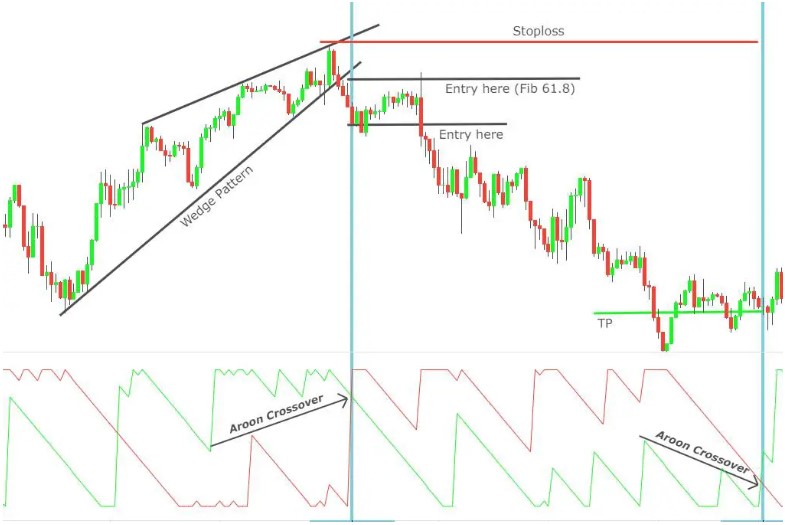
Conversely, when the Aroon Down line crosses below the Aroon Up line, it may indicate a potential shift from a downtrend to an uptrend. Traders can look for these crossover points to anticipate trend reversals and adjust their trading strategies accordingly.
3. Confirming Trend Breakouts
Traders often use the Aroon indicator to confirm trend breakouts. When an asset's price breaks above a resistance level accompanied by a rise in the Aroon Up line and a decline in the Aroon Down line, it suggests a bullish breakout.
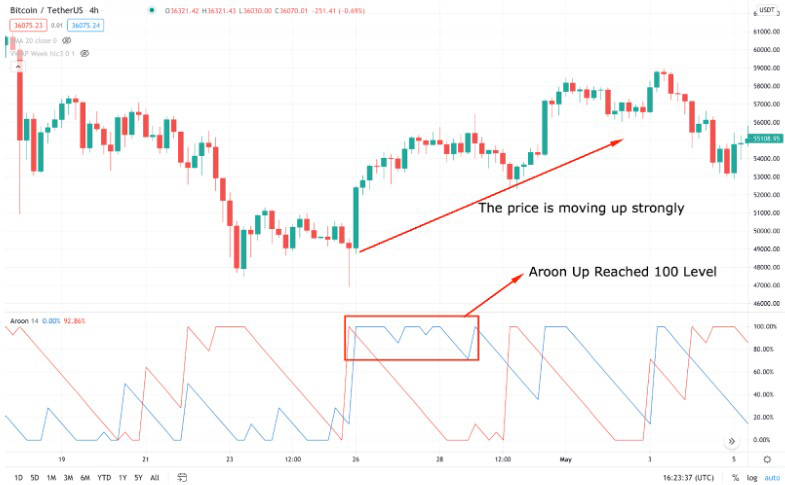
Conversely, when the price breaks below a support level accompanied by a rise in the Aroon Down line and a decline in the Aroon Up line, it indicates a bearish breakout. Traders can use the Aroon indicator to validate these breakouts and enter trades with more confidence.
4. Divergence Analysis
Traders may also analyze divergences between the Aroon indicator and the price. For example, if the price of an asset is making higher highs, but the Aroon indicator is making lower highs, it could indicate a potential weakening of the current trend. This divergence may serve as an early warning sign for a potential trend reversal.
Aroon Indicator Formula
The Aroon indicator consists of two lines: the Aroon Up line and the Aroon
- Down line. The formula to calculate the Aroon indicator values is as follows:
- Aroon Up = ((Number of periods - Number of periods since the highest high) / Number of periods) * 100
Aroon Down = ((Number of periods - Number of periods since the lowest low) / Number of periods) * 100
How to calculate Aroon Indicator
To break it down step-by-step:
- Determine the number of periods you want to consider for the Aroon indicator calculation. This could be days, weeks, or any other timeframe you choose.
- Find the highest high within the specified number of periods. This represents the highest price value reached during that period.
- Calculate the number of periods since the highest high. This is the number of periods that have passed since the highest high was recorded.
- Divide the number of periods minus the number of periods since the highest high by the total number of periods and multiply the result by 100. This gives you the Aroon Up value.
- Find the lowest low within the specified number of periods. This represents the lowest price value reached during that period.
- Calculate the number of periods since the lowest low. This is the number of periods that have passed since the lowest low was recorded.
- Divide the number of periods minus the number of periods since the lowest low by the total number of periods and multiply the result by 100. This gives you the Aroon Down value.
The Aroon Up line indicates the strength and timing of upward price movements, while the Aroon Down line indicates the strength and timing of downward price movements.
By analyzing the values of the Aroon Up and Aroon Down lines, traders can gain insights into the strength of a trend, potential trend reversals, and possible entry and exit points in their trading strategies.
Aroon Indicator Settings
The Aroon indicator has two key settings: the period and the threshold level for determining trend strength.
- Period: The period refers to the number of periods used in the calculation of the Aroon indicator. This could be days, weeks, or any other timeframe you choose based on your trading strategy and time horizon. Commonly used periods range from 14 to 25, but you can adjust it according to your preferences and the specific market you are analyzing.
- Threshold Level: The threshold level determines the cutoff point for identifying trend strength. It is often set at 50, dividing the Aroon indicator into two halves. Values above 50 indicate a stronger trend, while values below 50 suggest a weaker or more sideways market. You can adjust the threshold level based on your risk tolerance and trading preferences. Some traders may use a higher threshold, like 70 or 80, to consider a trend as stronger, while others may use a lower threshold, like 30 or 20, to allow for more flexibility in trend identification.
It looks like this:
- Period: 14
- Threshold level: 50
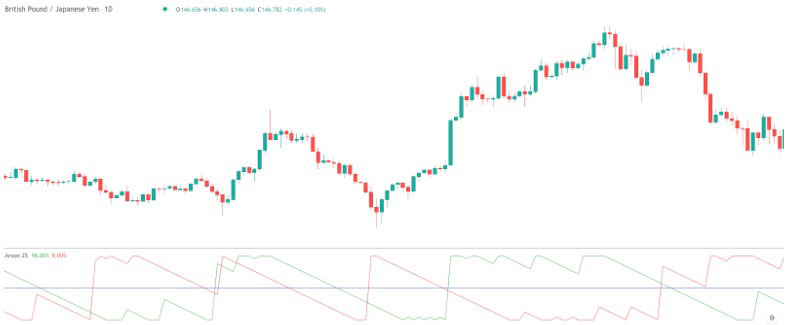
By adjusting the period and threshold level, traders can fine-tune the sensitivity of the Aroon indicator to suit their trading style and the specific market conditions they are analyzing. Shorter periods may provide more frequent signals but could be more sensitive to price noise, while longer periods may provide smoother signals but may lag behind in detecting trend changes.
Optimal settings for the Aroon indicator may vary depending on the market and the specific trading strategy you are using. We would recommend to experiment with different settings and assess their effectiveness in your trading before incorporating the Aroon indicator into your decision-making process.
Bottom line on Aroon Indicator
In conclusion, the Aroon indicator is a valuable tool in technical analysis that helps traders identify potential trend reversals, gauge trend strength, and set stop-loss levels and profit targets. It tracks the time since a security reached a new high or low, with the Aroon Up line measuring periods since the last new high and the Aroon Down line measuring periods since the last new low.
However, it's important to remember that the Aroon indicator should not be used in isolation as the sole basis for trading decisions. It is most effective when used in conjunction with other technical analysis tools and factors. Traders should consider combining it with additional indicators, price patterns, and fundamental analysis to gain a more comprehensive understanding of market conditions.
Furthermore, the Aroon indicator, like any indicator, has its limitations. It may produce false signals and can be sensitive to market volatility. Therefore, it's crucial to carefully assess its performance within the specific market context and adapt strategies accordingly.
By utilizing the Aroon indicator alongside other tools and techniques, traders can enhance their analysis and make more informed trading decisions. We always recommend practicing with the Aroon indicator on historical data to familiarize oneself with its behavior and optimize its usage in trading strategies.
Forex Indicators FAQ
What is a Forex Indicator?
Forex technical analysis indicators are regularly used by traders to predict price movements in the Foreign Exchange market and thus increase the likelihood of making money in the Forex market. Forex indicators actually take into account the price and volume of a particular trading instrument for further market forecasting.
What are the Best Technical Indicators?
Technical analysis, which is often included in various trading strategies, cannot be considered separately from technical indicators. Some indicators are rarely used, while others are almost irreplaceable for many traders. We highlighted 5 the most popular technical analysis indicators: Moving average (MA), Exponential moving average (EMA), Stochastic oscillator, Bollinger bands, Moving average convergence divergence (MACD).
How to Use Technical Indicators?
Trading strategies usually require multiple technical analysis indicators to increase forecast accuracy. Lagging technical indicators show past trends, while leading indicators predict upcoming moves. When selecting trading indicators, also consider different types of charting tools, such as volume, momentum, volatility and trend indicators.
Do Indicators Work in Forex?
There are 2 types of indicators: lagging and leading. Lagging indicators base on past movements and market reversals, and are more effective when markets are trending strongly. Leading indicators try to predict the price moves and reversals in the future, they are used commonly in range trading, and since they produce many false signals, they are not suitable for trend trading.

